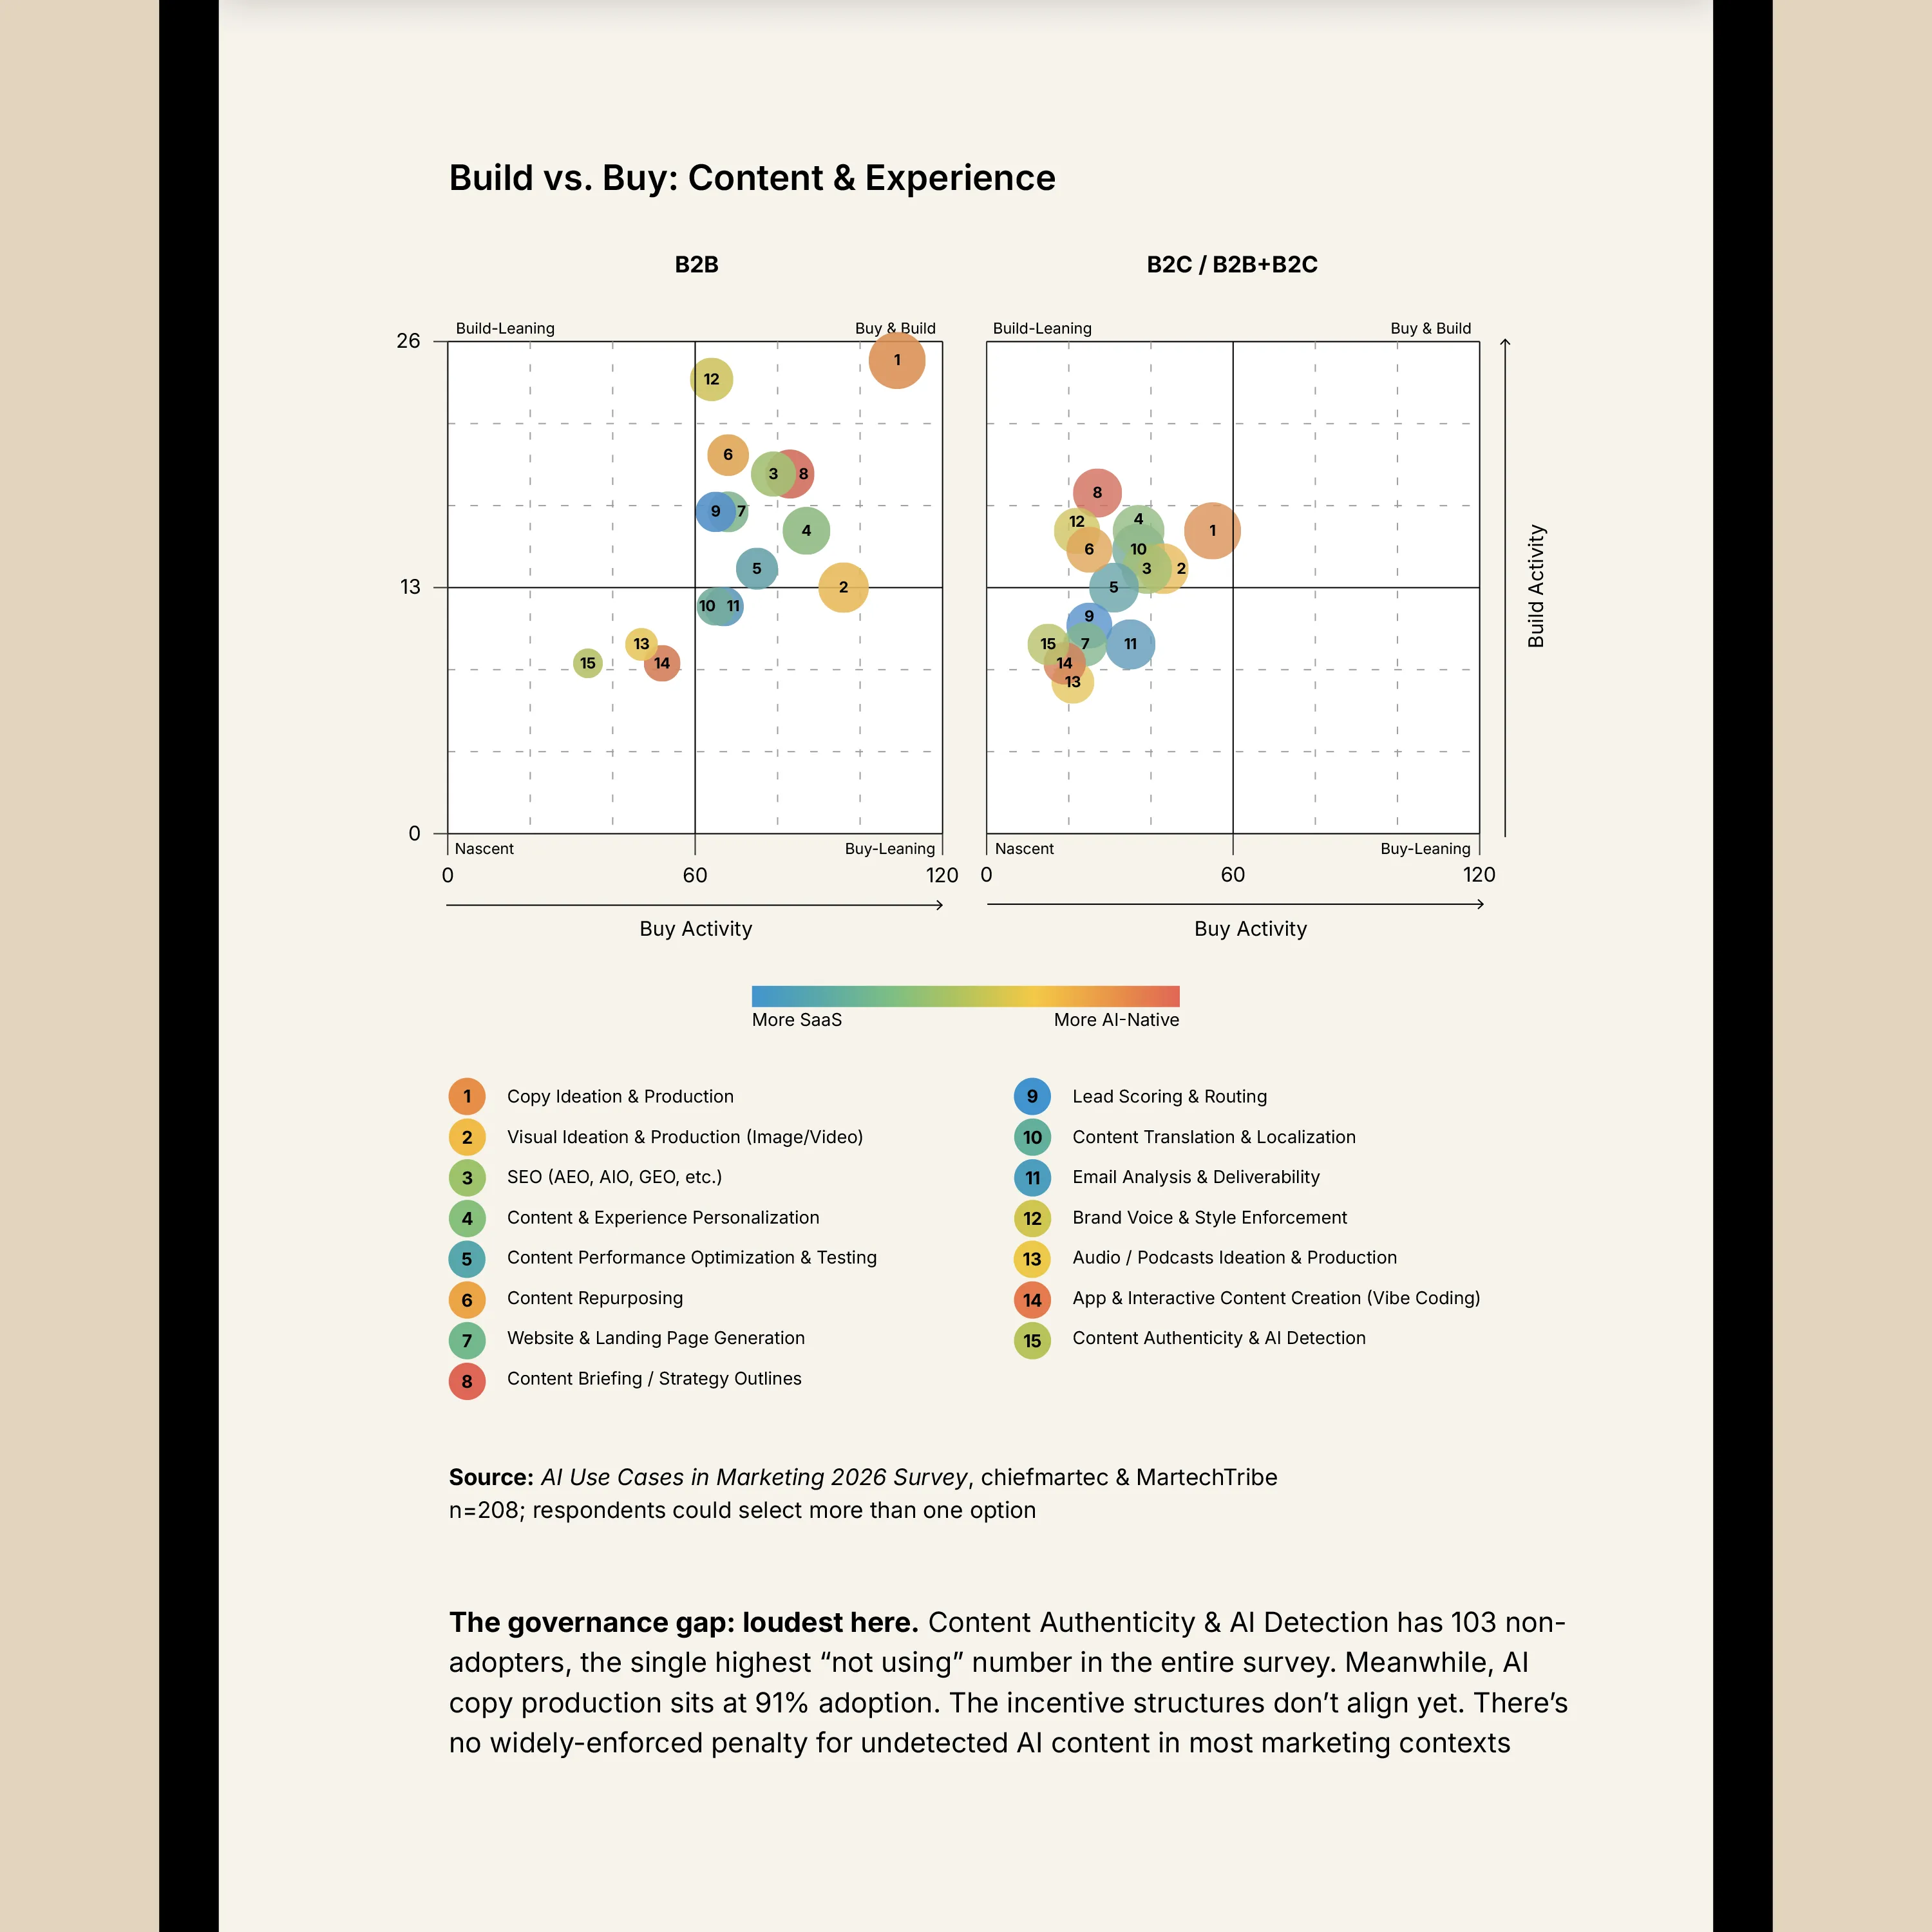
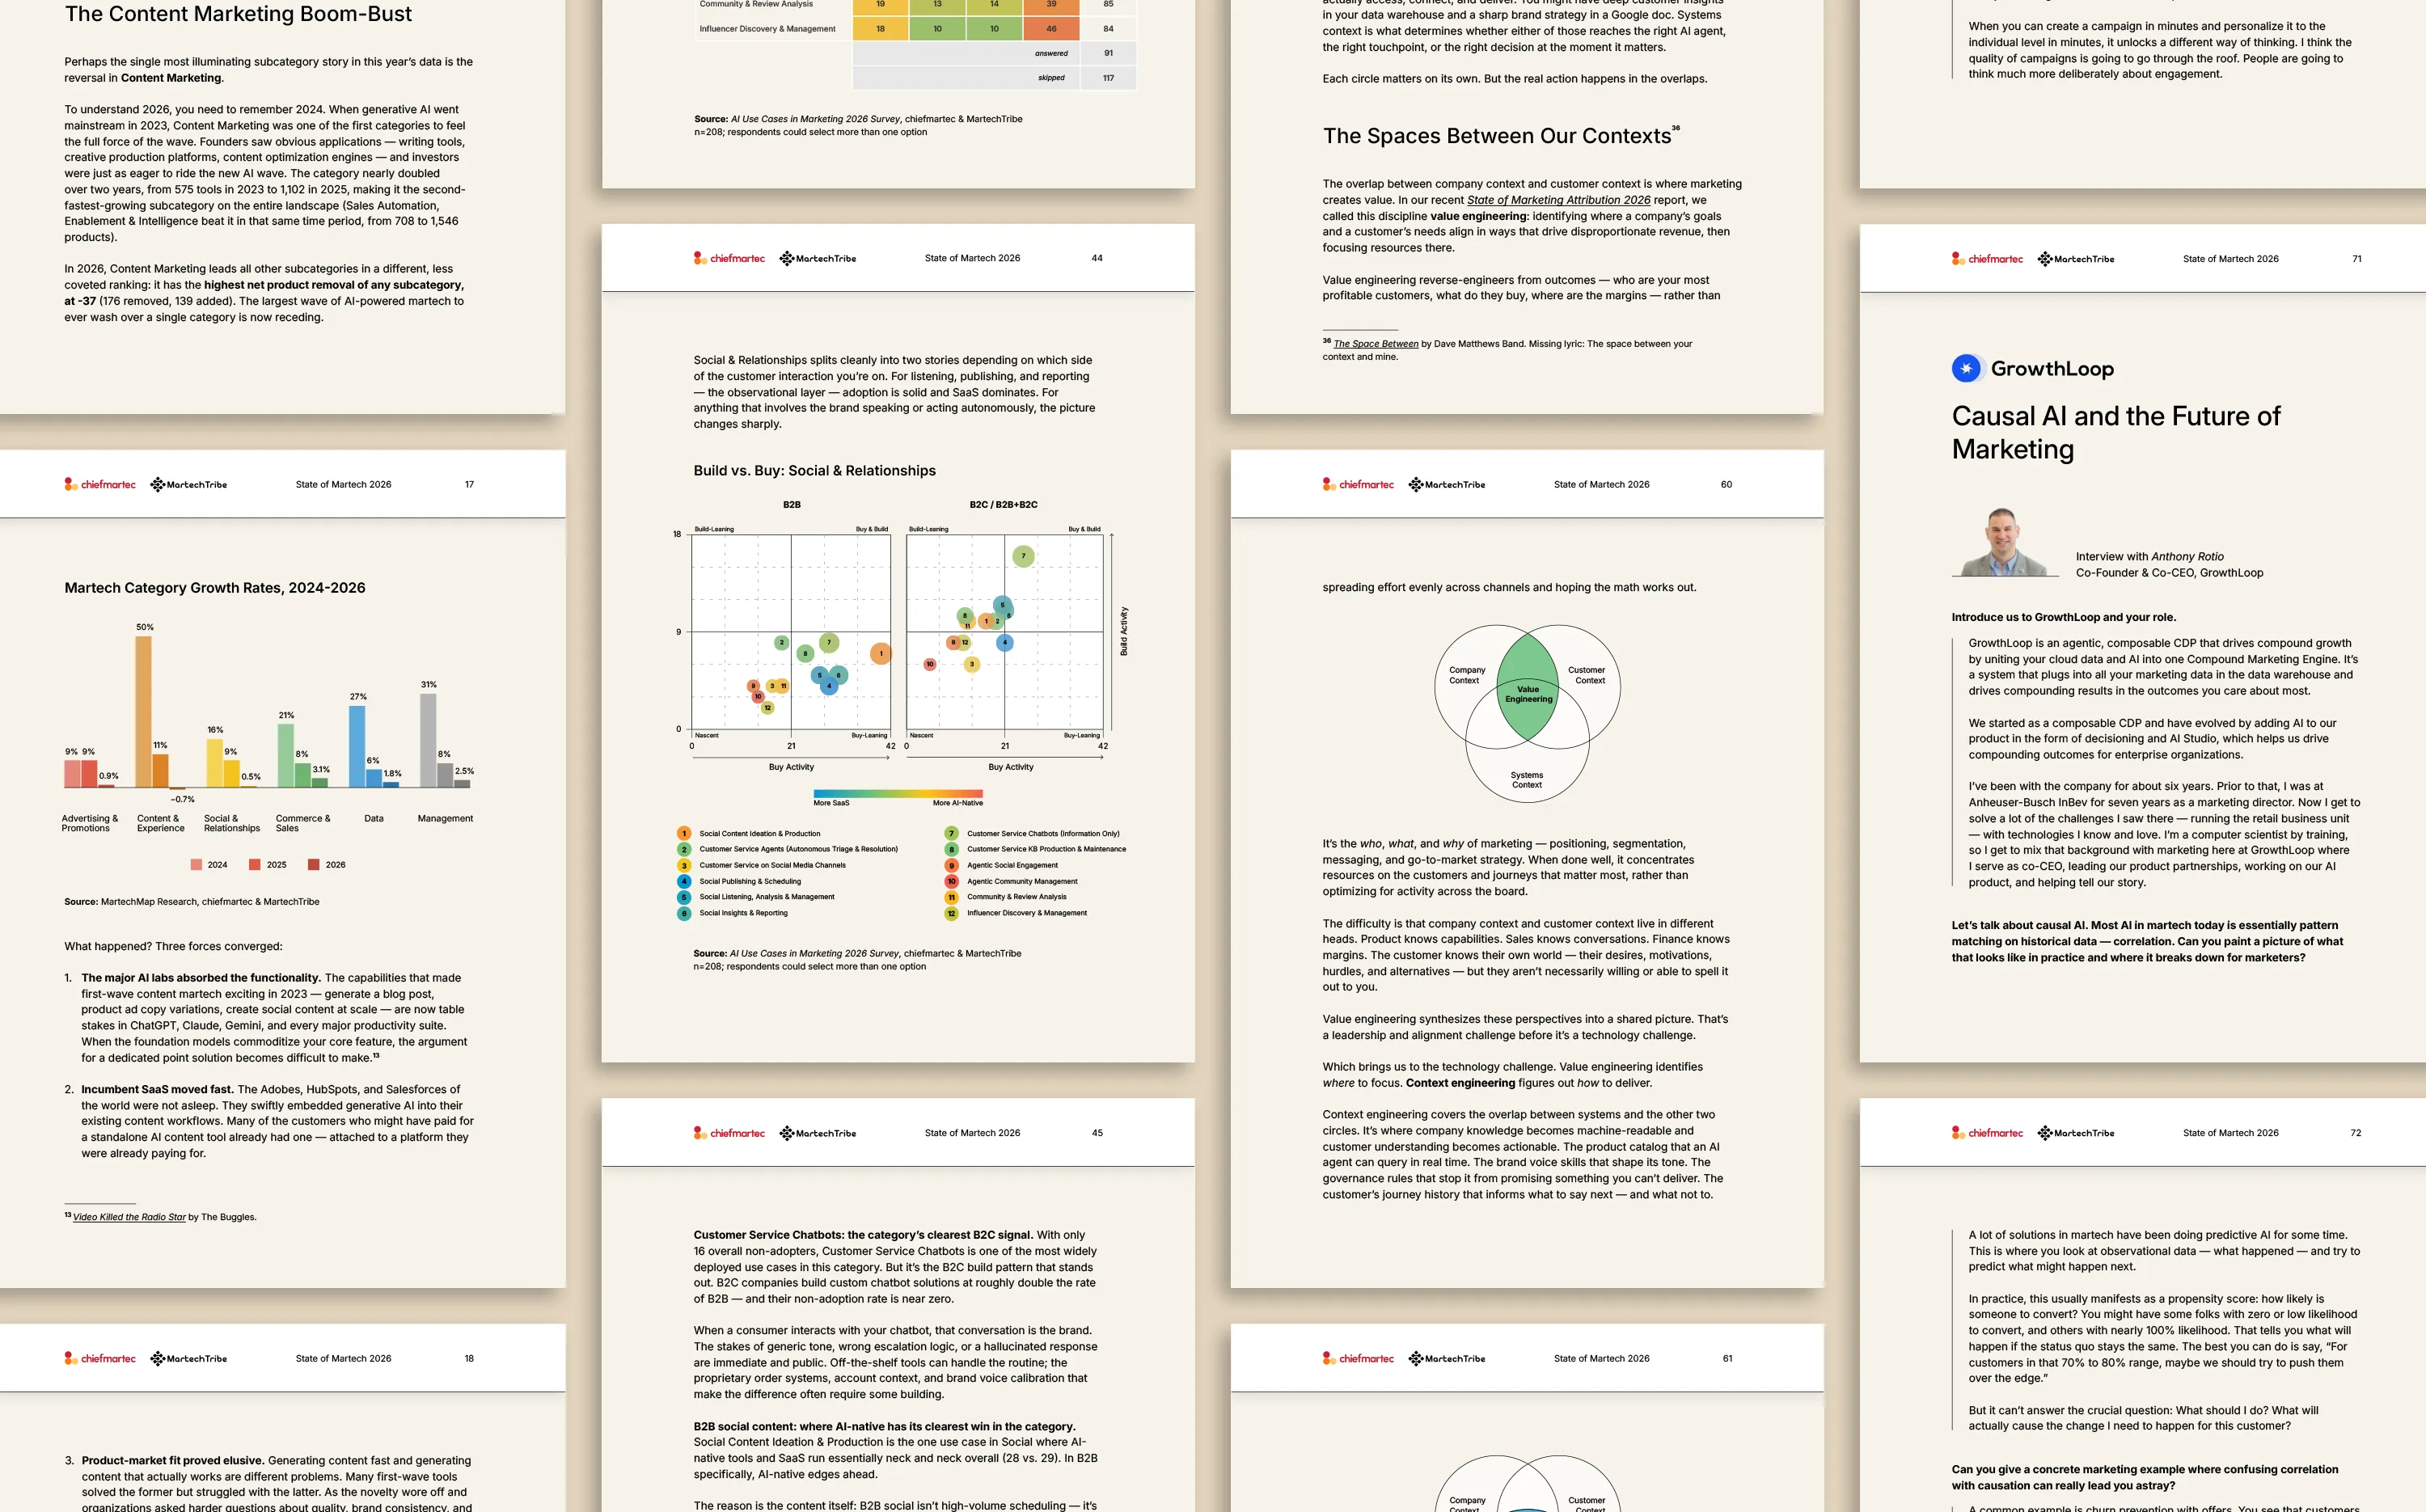
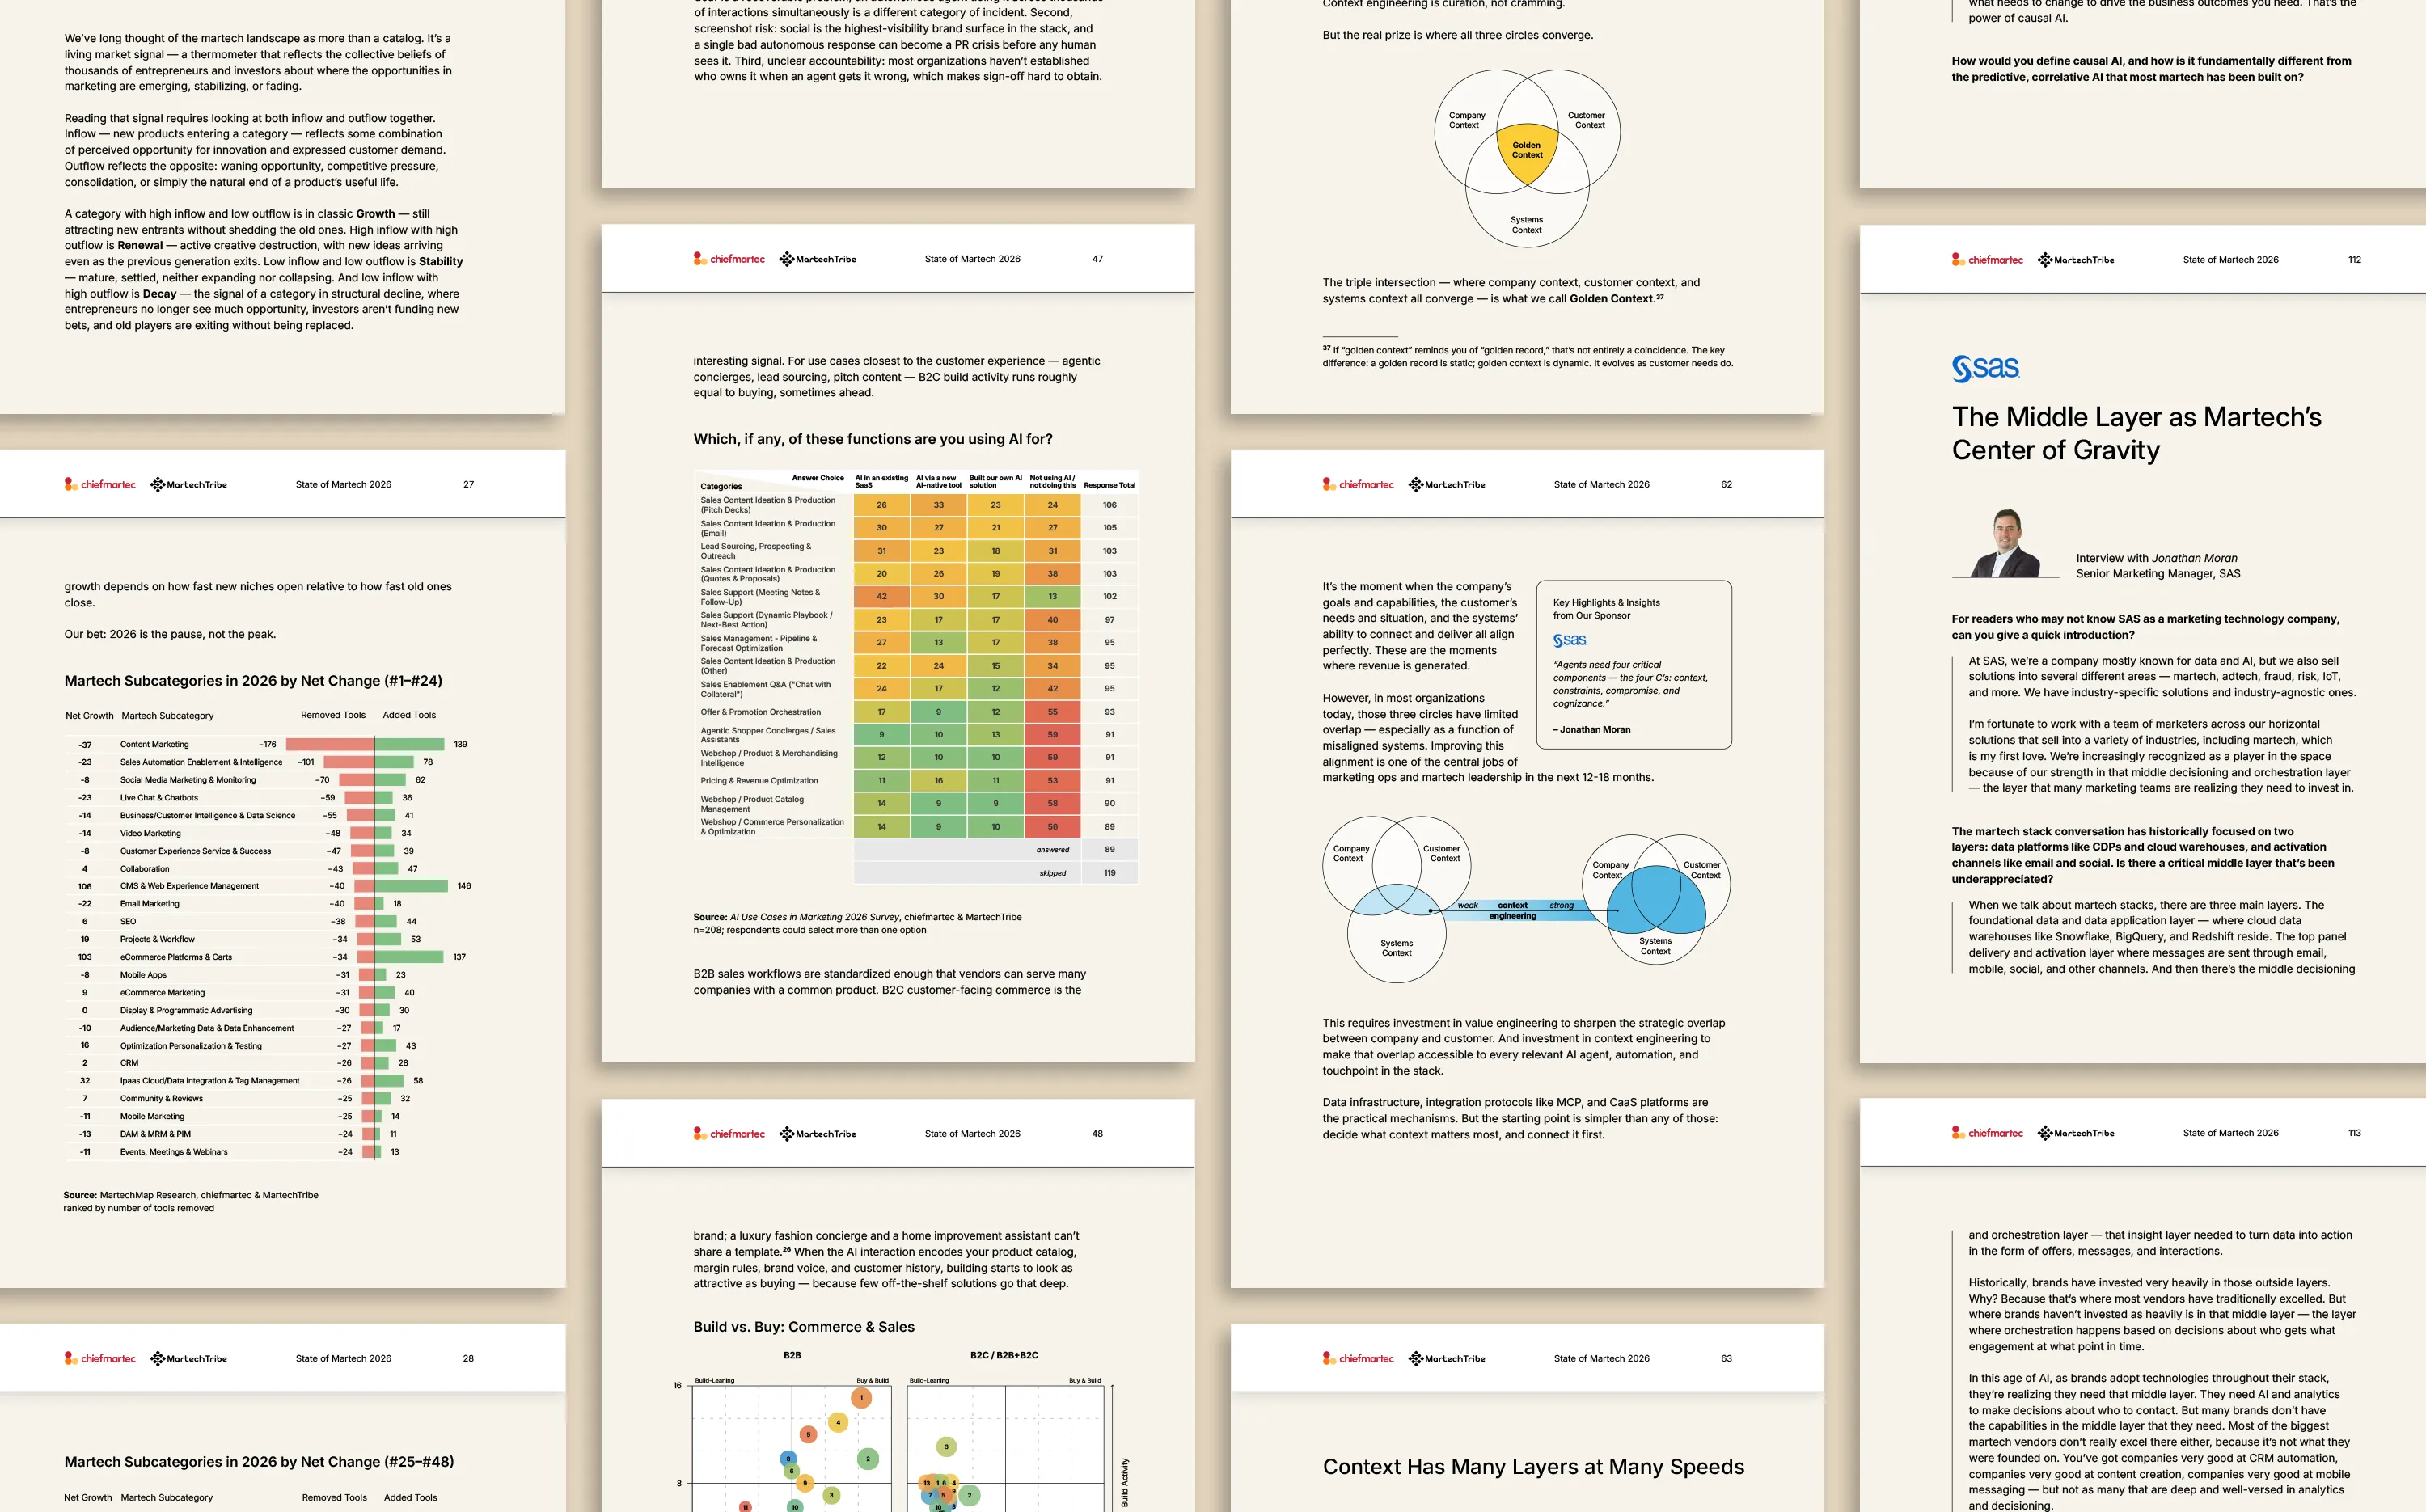
This year's edition introduced two new data visualization formats: bubble charts plotting build activity against buy activity across AI marketing use cases, and heatmaps showing how companies are implementing each one. Both presented a fresh design challenge, translating dense survey data into formats that stay readable on the page.